By Tobias Oker, Farm Advisor, UC Agriculture and Natural Resources
Keeping track of crop water use is an important aspect of irrigation water management. For this, accurate crop evapotranspiration data – that is the combination of water used by plants for transpiration and evaporation from adjacent surfaces – is needed. Today many growers and irrigation managers have tools they can use to estimate how much water to apply to their crops during different times of the season; a result of decades of research across the world that went into studying the water requirements of different crops.
An example is the California Irrigation Management Information System, or CIMIS as its commonly known, which is a weather-based system that relies on accurate estimation of reference evapotranspiration (ET). In meteorological terms, the reference ET is the total amount of water that would be transferred to the air, from a well-water short grass (about 5 inches high).
CIMIS operates a network of weather stations across California, which it uses to estimate daily reference ET. Crop water requirements are based off these daily estimates. Although such weather station measurements have proven to be a wonderful resource, an often-cited limitation is their sparseness in relation to the large expanse of agricultural areas, or even natural environments such as grasslands, forests et cetera. This means that the further away a field is from a given station, the less representative is data from that station. In short, for better estimates of reference ET, more weather stations are better than fewer stations. Other than the question of numbers, the greater concern though could be the health of some weather stations and therefore the ET data from them. Case in point: according to the American Society of Civil Engineers, standard weather stations typically require at least a 328 ft ‘fetch’ upwind of a well-water short grass for agricultural areas. Managing several weather stations to meet these criteria in what are usually dense agricultural zones comes with several challenges, one of which is ensuring that they are ‘well’ watered during the peak of the season.
To advance beyond point measurements of ET, in recent years there have been efforts to leverage the potential of remote sensing technology to estimate evapotranspiration at field and watershed scales. For water managers, this is an interesting development as estimation of field-scale ET has long been cited as one of their main challenges. Although it would appear that lately drones have overtaken the conversation about remote sensing technologies in general, a common method for computing remotely sensed ET over large areas relies on data from orbiting satellites and weather stations such as CIMIS. One such satellite is Landsat, which is a series of satellites, the first of which was first launched in 1972. So, one may ask why to compute ET using remote sensing considering it still requires data from ground weather stations. The answer to this question is that remote sensing gives us a bird’s-eye view of the surface energy balance beyond the weather station; with ET at the station serving as a reference. This bird’s-eye view comes in the form of gridded data at a pixel resolution of 98 x 98 ft. So, an important point here is that the accuracy of ET from remote sensing still requires good data from ground stations.
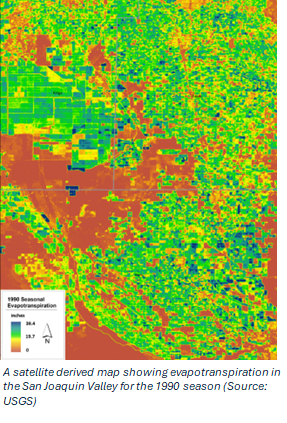
Presently, there are three operational Landsat satellites. These satellites collect data on thermal and spectral characteristics of land surfaces, which can then be translated to corresponding surface temperatures and vegetative indices – a measure of surface greenness. The basic idea in remote sensing of ET is to resolve the energy balance of a given land surface, the result of which is the energy component that accounts for the latent heat of vaporization, which is a proxy measurement of ET. This is the basis of several remote sensing ET models. Although their algorithms may differ, they have each been independently peer-reviewed, rigorously tested and found to generally return reasonable estimates of ET. There are, however, instances where such models return differing results, with some being more accurate, and others not. To try to address this, a community of researchers floated the idea of aggregating estimates from selected models and called this the OpenET project. The basic idea was to simultaneously run the different ET models using the same curated input data – to the extent possible – and then generate an additional model that combines the results from all models; the thinking being that the combination model most likely returns better evapotranspiration estimates. OpenET was first made publicly available in late 2021 and it currently comprises six different models and an ensemble of all the models. It is available online and data for western and midwestern states can be accessed from the platform by creating a user account.
These models are calibrated to improve their accuracy. In a first stage large intercomparison of data from OpenET with that from several flux towers, it was found that data from both were highly comparable. The same study also found that the mean absolute error of OpenET ranged from 0.5 to 0.9 inches per month, and 0.02 to 0.04 inches per day. A more recent study on almonds reported that OpenET was able to estimate water consumption of the trees within a 13% accuracy range. Although these error margins seem reasonable, some researchers have conducted independent comparison studies on various crops and found much higher values; with OpenET sometimes overestimating or even underestimating ET. The reasons for this are subject to continued study but it underscores an important point that users should generally scrutinize ET data from remote sensing to control for occasional inaccuracies.
There are other sources of remote sensing ET data, such as Land IQ. Remote sensing is a quickly developing field that could harness the advances in computing power and better data collection capacities. Considering the huge potential and practicability of remotely sensed ET, we could see much improved models in the years ahead.
Tobias Oker is a Soils & Irrigation Advisor at UC Cooperative Extension, Kern County. Office phone: (661) 868-6218 Email: teoker@ucanr.edu
Further reading
Melton, F. S., Huntington, J., Grimm, R., Herring, J., Hall, M., Rollison, D., Erickson, T., Allen, R., Anderson, M., Fisher, J. B., Kilic, A., Senay, G. B., Volk, J., Hain, C., Johnson, L., Ruhoff, A., Blankenau, P., Bromley, M., Carrara, W., … Anderson, R. G. (2022). OpenET: Filling a Critical Data Gap in Water Management for the Western United States. JAWRA Journal of the American Water Resources Association, 58(6), 971–994. https://doi.org/10.1111/1752-1688.12956
Knipper, K., Anderson, M., Bambach, N., Melton, F., Ellis, Z., Yang, Y., Volk, J., McElrone, A. J., Kustas, W., Roby, M., Carrara, W., Castro, S., Kilic, A., Fisher, J. B., Ruhoff, A., Senay, G. B., Morton, C., Saa, S., & Allen, R. G. (2024). A comparative analysis of OpenET for evaluating evapotranspiration in California almond orchards. Agricultural and Forest Meteorology, 355, 110146. https://doi.org/10.1016/j.agrformet.2024.110146
Allen, R. G. (2006). Footprint Analysis to Assess the Conditioning of Temperature and Humidity Measurements in a Weather Station Vicinity. World Environmental and Water Resource Congress 2006, 1–12. https://doi.org/10.1061/40856(200)292